1
2
3
4
5
6
7
8
9
10
11
12
13
14
15
16
17
18
19
20
21
22
23
24
25
26
27
28
29
30
31
32
33
34
35
36
37
38
39
40
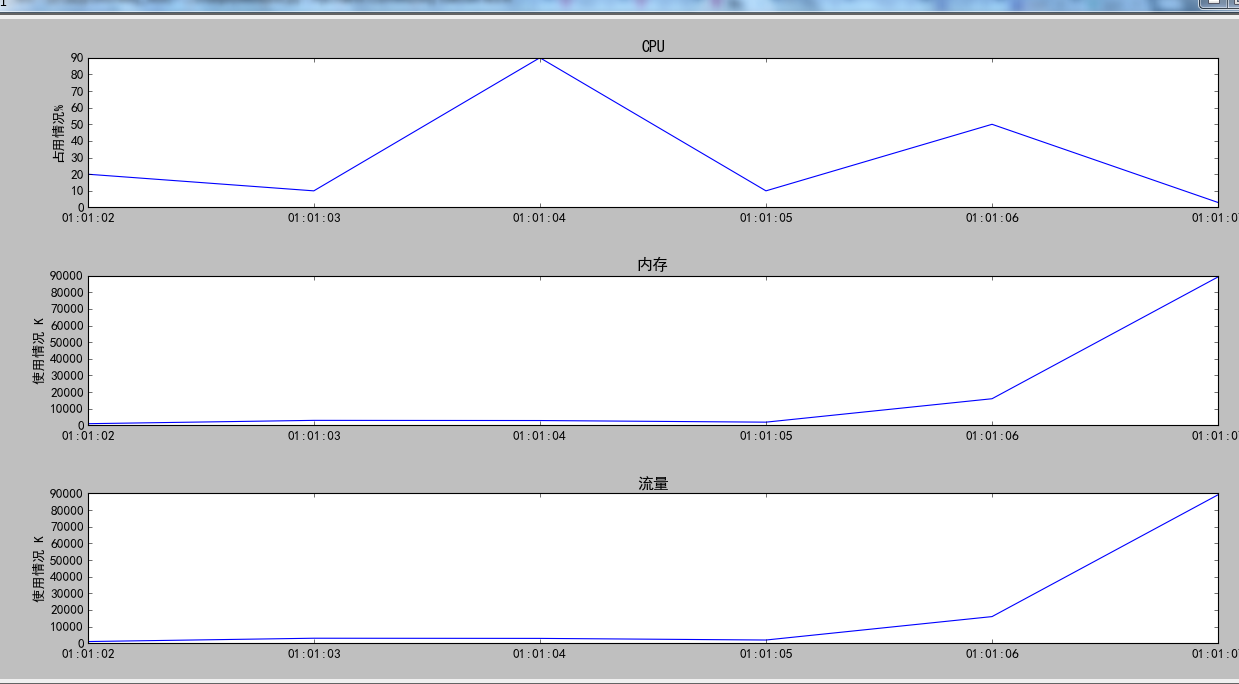
| import matplotlib.pyplot as pl
import matplotlib.dates as mdates
import datetime
x = [
datetime.datetime(2011,1,1,1,1,2),
datetime.datetime(2011,1,1,1,1,3),
datetime.datetime(2011,1,1,1,1,4),
datetime.datetime(2011,1,1,1,1,5),
datetime.datetime(2011,1,1,1,1,6),
datetime.datetime(2011,1,1,1,1,7),
]
list1 = [20,10,90,10,50,3]
list2 = [1000,3000,2899,1922,16000,89222]
a1 = pl.subplot(311) # 曲线图一
a1.set_title("CPU")
a1.set_ylabel("占用情况%")
a1.plot(x,list1)
# a1.xaxis.set_major_locator(mdates.SecondLocator(interval=2))
a1.xaxis.set_major_formatter(mdates.DateFormatter('%H:%M:%S'))
a2 = pl.subplot(312) #曲线图二
a3 = pl.subplot(313) #曲线图三
a2.set_title("内存")
a2.set_ylabel("使用情况 K")
a2.plot(x,list2)
# a1.xaxis.set_major_locator(mdates.SecondLocator(interval=2))
a2.xaxis.set_major_formatter(mdates.DateFormatter('%H:%M:%S'))
a3.set_title("流量")
a3.set_ylabel("使用情况 K")
a3.plot(x,list2)
# a1.xaxis.set_major_locator(mdates.SecondLocator(interval=2))
a3.xaxis.set_major_formatter(mdates.DateFormatter('%H:%M:%S'))
# a1.margins(x=0.2)
pl.tight_layout()
pl.show()
|